
US Job Market & UK Policy Conundrum
30 9 月, 2022
Signs of a Cooling Job Market Emerge
The Fed announced last week it will be raising interest rates by 75 basis points for the 3rd time, bringing the Fed Funds Rate to a range of 3.0%-3.25%, the highest it’s been since 2008. The Fed has remained aggressive in its fight against inflation, citing the strong labor market as its main reason. Powell stated that the Fed will need to keep the Fed Funds Rate at a “Restrictive Level” until a few factors change, with the main one being a movement in the labor market, i.e. a return to a better balance between supply and demand.
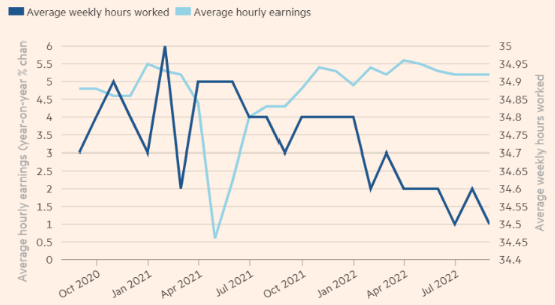
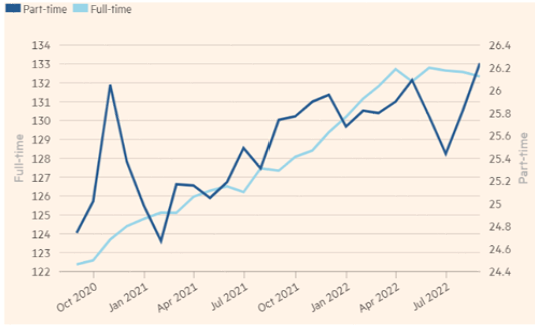
Recent data has begun to indicate the US labor market may not be as strong as many believe it to be. One sign is a lower number of full-time jobs paired with rapidly increasing part-time employment. While the household survey reported a healthy jump in employment, totaling 442,000 in August, all of those jobs can be attributed to part-time workers. The actual number of full-time jobs fell by 242,000, marking the 3rd month in a row of falling full-time job numbers. Another sign of weakening in the labor markets is the decrease in the number of hours companies are asking of their workers each week. The labor department report shows that the average work week is down to 34.5 hours, the lowest it has been since April 2020.
Fed Chairman Powell was not bashful when discussing the economic environment needed to bring inflation to the Fed’s 2% target. Stating “a sustained period of below trend growth” and a “softening in the labor market” will have to be endured, the latter of which we are beginning to see. As economic growth weakens and demand wanes, expect the job market to weaken further as well. This, in turn, may mean that we are closer to the Fed’s objectives than many realize.
UK Policy Conundrum
One foot on the gas, the other on the brake. The UK’s fiscal policy decision to cut tax rates amidst an already hawkish BoE led to a quick capitulation in UK markets last week. The mismatch in policy is reminiscent of an early 1980’s US fight against inflation. While the UK doubles down on fiscal measures, a strong BoE response provides potential for an attractive longer term entry point for the Pound.
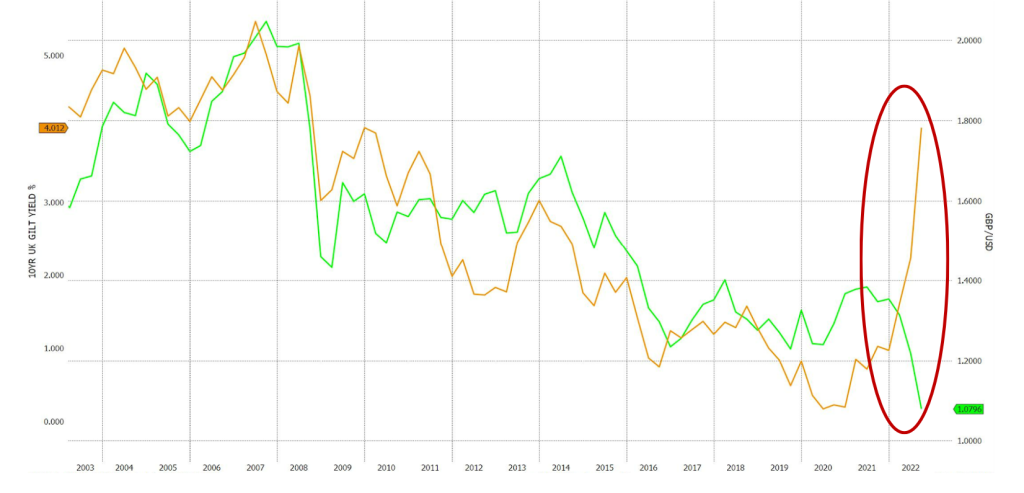
Under an already tight inflationary environment, with YoY inflation topping double digits, a hawkish BoE response will need to be aggressive. An upsized 100bps rate hike will be expected in November. The knock-on effect has resulted in higher GILT yields and terminal interest rates of 6.25% in mid-2023 vs. a month earlier forecast of 4.4%. Likened to Paul Volcker’s fight against early 80’s US inflation, the ‘Volcker Shock’ ultimately led to a stronger US dollar. The Pound has passed 1985 lows, down 26% YTD, on par with post crisis bear market figures.
The fiscal measures have mostly targeted energy subsidies combatting high energy prices heading into winter. However, short term tax subsidies impact how energy is paid for, not the ultimate cost. A temporary demand bump may be in the cards, but will contribute to an inflation problem in 2023. In the longer term, higher debt levels and GILT yields will weigh on GDP. Ultimately, the UK will need to alleviate deficits from fiscal stimulus with energy windfall taxation or spending cuts.
The resulting impact of fiscal measures, along with a cheaper pound, will lead to incrementally higher inflation into 2023. While the BoE remained firm on combatting inflation and offsetting fiscal measures, they have temporarily stepped in to purchase bonds in efforts of yield curve management. Not all is bleak, FTSE 100 companies generate >70% of their revenue abroad, benefiting from the weak Pound and at cheap valuations. But in the end, BoE hawkish policy action will push the UK into an unavoidable recession as tax cut generated demand and weak Pound led inflation remain.
DEFINITIONS & DISCLOSURES
The information provided is for educational purposes only. The views expressed here are those of the author and may not represent the views of Leo Wealth. Neither Leo Wealth nor the author makes any warranty or representation as to the accuracy, completeness, or reliability of this information. Please be advised that this content may contain errors, is subject to revision at all times, and should not be relied upon for any purpose. Under no circumstances shall Leo Wealth be liable to you or anyone else for damage stemming from the use or misuse of this information. Neither Leo Wealth or the author offers legal or tax advice. Please consult the appropriate professional regarding your individual circumstance. Past performance is no guarantee of future results.
This material represents an assessment of the market and economic environment at a specific point in time and is not intended to be a forecast of future events, or a guarantee of future results.
Forward-looking statements are subject to certain risks and uncertainties. Actual results, performance, or achievements may differ materially from those expressed or implied. Information is based on data gathered from what we believe are reliable sources. It is not guaranteed as to accuracy, does not purport to be complete and is not intended to be used as a primary basis for investment decisions. It should also not be construed as advice meeting the particular investment needs of any investor. Past performance does not guarantee future results.
Indices are unmanaged and investors cannot invest directly in an index
The Financial Times Stock Exchange 100 Index, also called the FTSE 100 Index, FTSE 100, FTSE, or, informally, the “Footsie” is a share index of the 100 companies listed on the London Stock Exchange with the highest market capitalization. It is seen as a gauge of prosperity for businesses regulated by UK company law.