
Fixed Rate Mortgage: A Factor in U.S. Resiliency
March 6, 2024
When asked about the resilience of the U.S. economy, many economists point to Silicon Valley, unbridled capitalism, the prevalence of tech stocks, a flexible employment market, lots of natural resources, and a culture of innovation. All of these are true, but among them should be another advantage available to the U.S. economy vs others in the last few years: fixed rates.
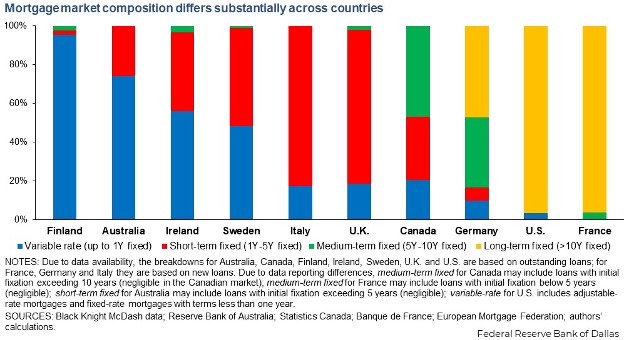
Unlike most major economies (except France), the U.S. is a predominantly fixed-rate mortgage market. This didn’t use to be the case of course, but the sub-prime crisis changed behavior, causing Americans to aggressively shift away from floating rate debt where they could. Fixed-rate mortgages provide stability to households and allow the transfer of risk from individuals to banks and other institutional investors. In short, they provide certainty of income net of borrowing costs and thus enable greater spending. The result is quite staggering – despite mortgage rates of ~7% today, the average American is still paying only ~4% and will continue to do so for quite a few years.
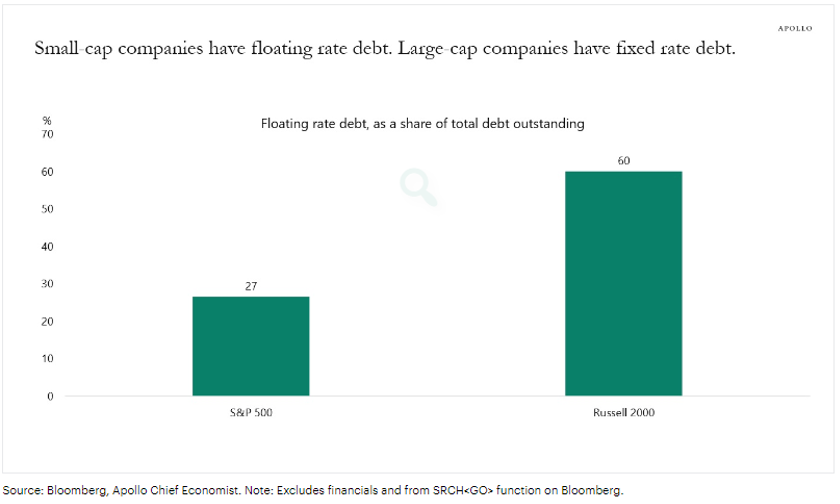
This happens at the corporate level too, albeit with larger corporates mainly. 63% of debt outstanding by S&P 500 companies is fixed rate, which means they too are insulated from higher rates for now. Small caps are not as lucky: 60% of their borrowing is of the floating rate variety, meaning they will start to see pressure soon if the Fed doesn’t lower rates.
This has substantial implications for investors. The monetary policy transmission mechanism will be shorter in Europe and Australia, for example, than in the U.S. Floating rate economies will see recessions faster via higher rates, which explains the resilience of the U.S economy so far during this hiking cycle. A slowdown will not be denied, however, just delayed until higher rates really start to bite. This key differentiator is what keeps us positive on U.S. equity markets in coming months, but worried about what lays ahead on a 12-18 month horizon.
DISCLOSURES
The information provided is for educational purposes only. The views expressed here are those of the author and may not represent the views of Leo Wealth. Neither Leo Wealth nor the author makes any warranty or representation as to this information’s accuracy, completeness, or reliability. Please be advised that this content may contain errors, is subject to revision at all times, and should not be relied upon for any purpose. Under no circumstances shall Leo Wealth be liable to you or anyone else for damage stemming from the use or misuse of this information. Neither Leo Wealth nor the author offers legal or tax advice. Please consult the appropriate professional regarding your individual circumstance. Past performance is no guarantee of future results.
This material represents an assessment of the market and economic environment at a specific point in time. It is not intended to be a forecast of future events or a guarantee of future results.
Indices are unmanaged and investors cannot invest directly in an index.
The Standard & Poor’s 500 (S&P 500) Index is a free-float weighted index that tracks the 500 most widely held stocks on the NYSE or NASDAQ and is representative of the stock market in general. It is a market value weighted index with each stock’s weight in the index proportionate to its market value.
The Russell 2000measures the performance of small capitalization U.S. stocks. The Russell 2000 is a market-value-weighted index of the 2,000 smallest stocks in the broad-market Russell 3000 Index.