
Cautiously Optimistic on China
August 11, 2023
Over the last 5 days in July, foreign investors added net ~49bn yuan worth of mainland stocks via trading links with Hong Kong. The net monthly inflow of ~47bn yuan in July was the largest since January, when China finally reopened their borders and moved away from its zero-Covid strategy. After lagging global peers over the past 12 months, is the tide finally turning for Chinese equities? We think so and continue to remain cautiously optimistic.
Recent weaker-than-expected economic data have ignited concerns regarding deflation and slowing growth. However, this could be a case of bad news is good news. With each additional data point that disappoints, the probability and expectation for more stimulus measures increase. In the recent Politburo meeting on 24 Jul, officials have pledged to shore up economic growth and ease property restrictions. Since then, the MSCI China Index gained 9.4% in USD terms, outperforming the S&P 500’s gain of 0.8%.
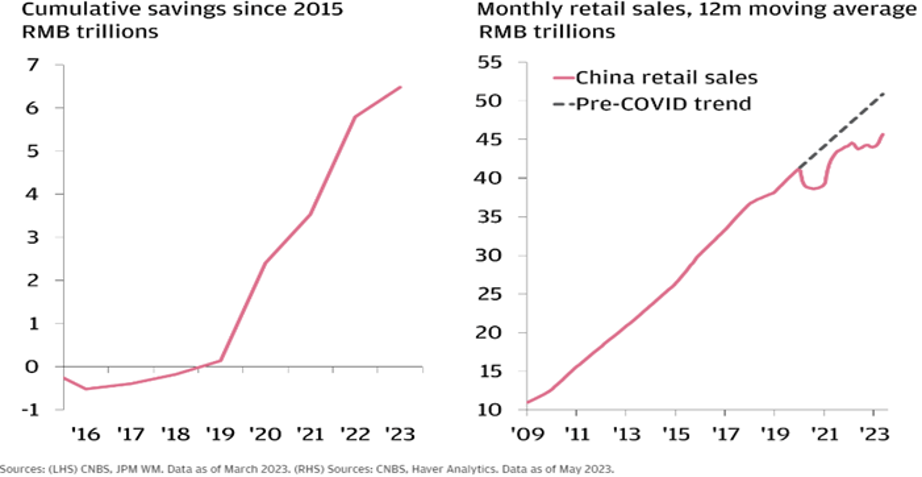
There are plans to boost domestic demand for items such as autos, electronics, household products and services such as tourism. Chinese consumers are sitting on hordes of excess savings which were amassed during the pandemic, just like the US was 12 months ago. With retail sales still ~10% below their pre-Covid trend, there is potential for domestic consumption to pick up in the coming months.
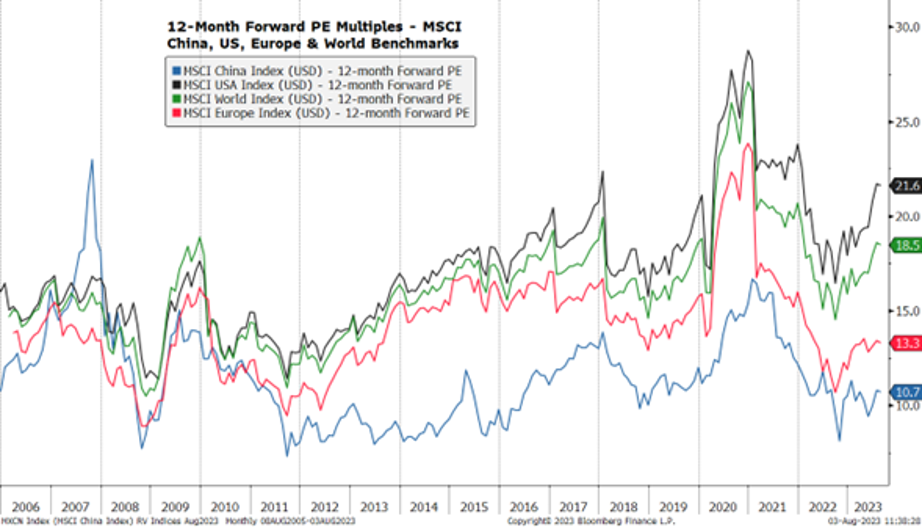
From a valuation perspective, China equities remain attractive. The 12-month forward P/E of MSCI China is currently at 10.7x, up from 8.1x in Oct 2022, but still below its 5-year average of 12.1x. Comparatively, the P/E of S&P500 is 19.5x (vs 5yr average of 18.8x), while that of MCSI World Index is at 17.5x (vs 5yr average of 17.3x).
Other factors supporting more Chinese equities upside include the end of a 32-month regulatory crackdown on the tech sector, boosting credit to SME’s and pledging to bring down local government debt levels. Most notably, the Politburo’s language on property has become softer. President Xi’s slogan that “houses are for living, not for speculation” was omitted in the mid-year review for the first time since 2019.
In summary, an improving policy landscape, coupled with attractive valuations, give us reason to believe Chinese equities is nearing an inflection point. We continue to remain optimistic on the longer-term prospects of Chinese stocks.
DISCLAIMERS & DEFINITIONS
The information provided is for educational purposes only. The views expressed here are those of the author and may not represent the views of Leo Wealth. Neither Leo Wealth nor the author makes any warranty or representation as to this information’s accuracy, completeness, or reliability. Please be advised that this content may contain errors, is subject to revision at all times, and should not be relied upon for any purpose. Under no circumstances shall Leo Wealth be liable to you or anyone else for damage stemming from the use or misuse of this information. Neither Leo Wealth nor the author offers legal or tax advice. Please consult the appropriate professional regarding your individual circumstance. Past performance is no guarantee of future results.
This material represents an assessment of the market and economic environment at a specific point in time. It is not intended to be a forecast of future events or a guarantee of future results.
Indices are unmanaged and investors cannot invest directly in an index. Unless otherwise noted, performance of indices does not account for any fees, commissions or other expenses that would be incurred. Returns do not include reinvested dividends.
The Standard & Poor’s 500 (S&P 500) Index is a free-float weighted index that tracks the 500 most widely held stocks on the NYSE or NASDAQ and is representative of the stock market in general. It is a market value weighted index with each stock’s weight in the index proportionate to its market value.
The MSCI China Index captures large and mid-cap representation across China A shares, H shares, B shares, Red chips, P chips and foreign listings (e.g. ADRs). With 738 constituents, the index covers about 85% of this China equity universe. Currently, the index includes Large Cap A and Mid Cap A shares represented at 20% of their free float adjusted market capitalization.
The MSCI World Index is a free float-adjusted market capitalization weighted index that is designed to measure the equity market performance of developed markets.
The MSCI USA Index is designed to measure the performance of the large and mid cap segments of the US market. With 623 constituents, the index covers approximately 85% of the free float-adjusted market capitalization in the US. The MSCI Europe Index captures large and mid cap representation across 15 Developed Markets (DM) countries in Europe. With 429 constituents, the index covers approximately 85% of the free float-adjusted market capitalization across the European Developed Markets equity universe.