
Treasury Market Pause & Big Tech
April 2, 2023
Treasury market is sensing a Fed policy pause on the horizon
Tighter credit provisions by the U.S. banking system are likely to create a headwind for U.S. GDP growth in the months ahead. This disinflationary impulse from the banking system reduces (and potentially reverses) the need for monetary policymakers to slow the economy through interest rate hikes. In our view, the Fed would be risking a policy error if it proceeds with further interest rate increases. Such action would further undermine the banking sector’s profitability as the shape of the yield curve and the level of the policy rate are direct inputs into bank funding costs and bank portfolios. Furthermore, it would reignite deposit flight from smaller/regional banks to higher yielding safe havens such as money market funds. The latter have seen record inflows (YTD cumulative inflows of $448bn) and have now reached a record asset level of $5.1 trillion. In contrast, commercial bank deposits in the U.S. regional banks have fallen by ~$110bn in the last few weeks.
The Treasury Yield Curve (orange line in below chart) is starting to un-invert or steepen from a very low historical level. In the past month, the 2 Year Treasury yield declined at a faster pace (-0.75% decline) than the 10 Year yield (-0.36% decline). The Fed fund futures market is now pricing in -0.70% of rate cuts to year-end, with the implied rate for the Fed’s December meeting standing at 4.3%. A lower 2 Year Treasury yield (blue line) is starting to diverge from the Fed Funds Rate (black line). In short, the Treasury market is starting to signal the beginning of the end for the Fed’s interest rate hiking cycle. Given the long and variable lags with which monetary policy impacts the real economy and underlying inflation, we believe interest rates are at a sufficiently restrictive level to achieve the Fed’s goal of reigning in inflation expectations. Therefore, a Fed monetary policy pause is warranted.
In conclusion, the Treasury market is starting to price in the end of the Fed’s hiking cycle and is starting to signal a Fed policy pause on the horizon. The market is thus seeing a shift from monetary tightening to credit tightening. It remains to be seen to what degree credit tightening may slow the economy and the labor market. However, it’s likely that disinflationary trends will enable the Fed to shift to a more market friendly posture, with positive implications for real rate and USD sensitive asset categories.

Big Tech – Still Quality Despite Risks
March 8 th marked the start of a tumultuous past 3 weeks for banks. Since then, the S&P500 Financials Index fell 10% while the broader S&P500 Index is largely unchanged, as of 27 Mar 2023. Defensive sectors such as consumer staples and utilities ended the period +2.3% and +0.5% respectively, while the tech-heavy Nasdaq Composite returned a decent +2.2%.
In stark contrast, the NYSE Fang+ Index, an equal-weighted index of 10 highly-traded large-cap tech stocks, returned 7.4%. The top three mega caps – Apple, Alphabet, Microsoft – rallied on average 6.3%, while other large caps such as Meta and Nvidia soared more than 9% individually. This has led some to proclaim big tech as the new safe haven amid the current banking turmoil.
Investors have piled into mega cap tech companies due to their high-quality traits. Companies such as Microsoft and Apple possess balance sheet strength and have large amounts of cash reserves, which they can draw upon instead of issuing new debt in a tight credit market. Others such as Meta, AMD and Alphabet have modest-to-low debt levels, lowering the probability of default risk. Finally, tech giants such as Amazon and Meta carried out cost-cutting layoffs since Q4 last year. These measures are expected to relieve margin compression pressure and boost earnings.
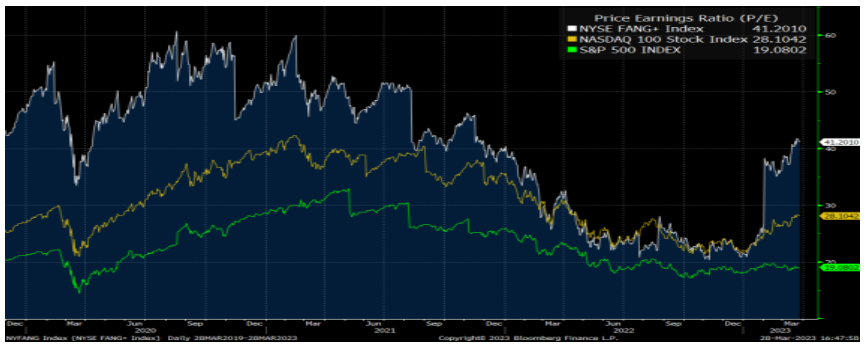
Despite their high-quality nature, certain risks remain. Firstly, valuations are lofty again. Since the turn of the year, the P/E of the NYSE Fang Index has from 22x to 41x, the most expensive it’s been since Dec 2021. Secondly, the recent tech rally was largely driven by falling yields and the expectation of rate cuts, forecasted to be delivered as early as Q3. Fed funds futures are currently pricing three 25bp cuts over the next 10 months. This contrasts with the Fed’s insistence that there will be no pivot this year. If the banking sector tumult eases, expectation of rate cuts this year could drop and yields could rebound. Lastly, from a macro standpoint economic growth outlook remains murky. Stresses in the financial sector is likely to give rise to tighter credit conditions which will slow the economy. Despite recent cost-cutting layoffs, the number of workers at Amazon, Microsoft and Alphabet still exceed pre-pandemic levels significantly. Continued earnings compression is a risk.
In conclusion, while big tech remains a quality play, there are still risks to be mindful of. To categorise them as safe haven play would be a misnomer.

DISCLAIMERS & DEFINITIONS
This material represents an assessment of the market and economic environment at a specific point in time and is not intended to be a forecast of future events, or a guarantee of future results.
Forward-looking statements are subject to certain risks and uncertainties. Actual results, performance, or achievements may differ materially from those expressed or implied. Information is based on data gathered from what we believe are reliable sources. It is not guaranteed as to accuracy, does not purport to be complete and is not intended to be used as a primary basis for investment decisions. It should also not be construed as advice meeting the particular investment needs of any investor. Past performance does not guarantee future results.
Investing internationally carries additional risks such as differences in financial reporting, currency exchange risk, as well as economic and political risk unique to the specific country. This may result in greater share price volatility. Shares, when sold, may be worth more or less than their original cost.
Indices are unmanaged and investors cannot invest directly in an index. Unless otherwise noted, performance of indices do not account for any fees, commissions or other expenses that would be incurred. Returns do not include reinvested dividends.
The Standard & Poor’s 500 (S&P 500) is an unmanaged group of securities considered to be representative of the stock market in general. It is a market value-weighted index with each stock’s weight in the index proportionate to its market value.
The Nasdaq Composite Index is a market-capitalization weighted index of the more than 3,000 common equities listed on the Nasdaq stock exchange. The types of securities in the index include American depositary receipts, common stocks, real estate investment trusts (REITs) and tracking stocks. The index includes all Nasdaq listed stocks that are not derivatives, preferred shares, funds, exchange-traded funds (ETFs) or debentures.
The S&P 500 Financials Index comprises those companies included in the S&P 500 that are classified as members of the GICS® financials sector.
The NYSE FANG+ index is an equal-dollar weighted index designed to represent a segment of the technology and consumer discretionary sectors consisting of large and highly traded names such as Meta (Facebook), Apple, Amazon, Netflix and Alphabet (Google).